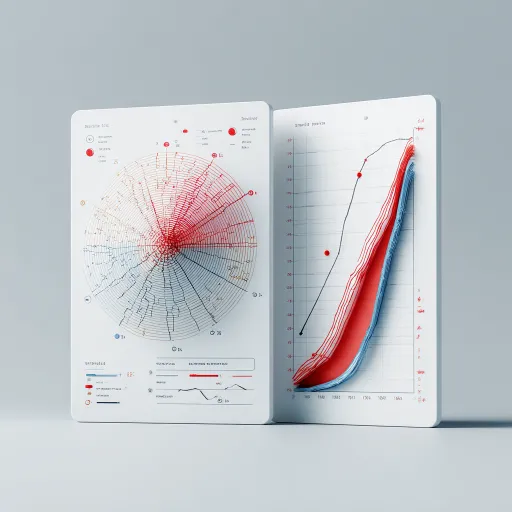
一个专业的科学图表组合,左侧为雷达图展示
提示词:https://images.gogpt.vip/aigf/origin/20251115/1763137456827476_1.png https://images.gogpt.vip/aigf/origin/20251115/1763137456827476_2.png A professional scientific chart combination, with a radar chart on the left showing the FITT-VP six dimensions including frequency, intensity, time, type, volume, and progression distribution. A red curve highlights the patient's dangerous training mode, and the volume and progression indicators exceed the normal range. On the right is a schematic diagram of the training advancement slope. The flat blue curve represents the safe advancement path, and the steep upward red curve represents the dangerous advancement path. Damage points are marked on the dangerous path. The overall design adopts the Edward Tufte data art style, minimalist design, Octane rendering effect, bird's-eye view, and soft lighting to enhance contrast and detail clarity. --ar 1:1 --v 7 --stylize 100
素材来源:Midjourney中文版
Copyright©2017 Midjourney9.com All Right
Reserved 版权所有:成都金翼云科技有限公司 蜀ICP备2023008999号