画布布局 尺寸:横向A4(16:9比例,
 Midjourney Bot
更新时间:2025-11-03
05:20:32
Midjourney Bot
更新时间:2025-11-03
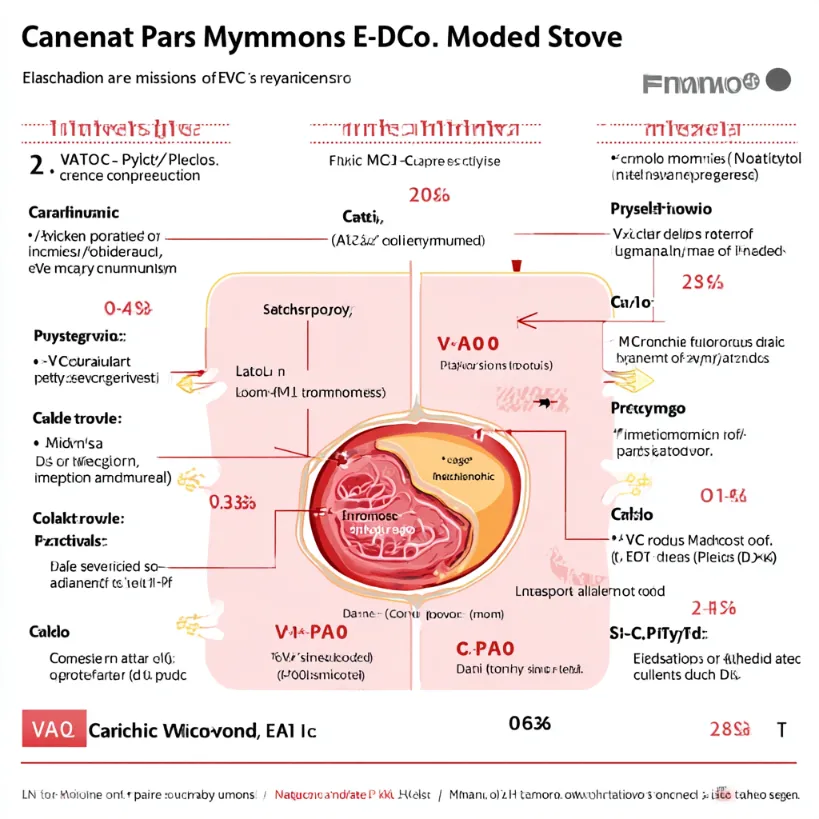
05:20:32提示词:Canvas Layout Size: Landscape A4 (16:9 ratio, suitable for PPT) Background: Light gray gradient (to avoid pure white glare) Core Division: Left Side (40% width): VA-ECMO Damage Pathway (red theme) Center (20% width): Cardiac Myocytes and Mitochondria (orange theme) Right Side (40% width): MTP-131 Protection Pathway (green theme) I. Center Core Area: Cardiac Myocytes and Mitochondria (visual focus) Cardiac Myocyte Outline Light pink irregular circle, labeled "Cardiac Myocyte", located slightly above the center of the canvas. Draw mitochondria in a lower internal position (orange double-membrane, inner membrane folded to form black ridge structure), labeled "Mitochondria". Inside the mitochondria, label "Cardiolipin (CL)" (yellow phospholipid molecule icon, distributed on the inner membrane ridges). Connecting Arrows Extend from the outer side of the cardiac myocyte to the left (red arrow) and to the right (green arrow), pointing towards the pathways on both sides. II. Left Side: VA-ECMO Damage Pathway (red arrow → cascade reaction) 1. VA-ECMO Initiation (top starting point) Elements: Blue extracorporeal circulation tubing icon (including pump and oxygenator), connecting to the left side of the cardiac myocyte. Text Label: "VA-ECMO Initiation" Below in small text: ① Inflammatory response ↑ (neutrophil icon); ② Mechanical stress stimulation (gear + wave line icon) 2. Oxidative Stress Outbreak (middle link) Elements: Red lightning symbol “⚡” (ROS), pointing from the tubing to the mitochondria. Text Label: "Oxidative Stress Outbreak" Below in small text: IRI + VA-ECMO double strike → Excessive ROS generation 3. Cardiolipin Metabolism Disorder (core damage) Elements: Yellow CL molecule covered by a red “X” (indicating oxidative degradation); Blue Tafazzin enzyme icon (labeled “Tafazzin”), with a downward red arrow ↓ (activity decrease). Text Label: "Cardiolipin Metabolism Disorder" Below in small text: ① CL oxidation → Ox-CL; ② Tafazzin inactivation → MLCL accumulation (MLCL/CL ratio ↑) 4. Mitochondrial Dysfunction and Myocardial Necrosis (bottom endpoint) Elements: Mitochondrial swelling and deformation (inner membrane rupture, ridges disappear); Release of red cytochrome c (small circle icon); Bottom black "Necrotic Area" icon (irregular shadow). Text Label: "Mitochondrial Dysfunction → Myocardial Necrosis" Below in small text: ① ETC collapse → ATP ↓; ② mPTP opening → apoptosis activation; ③ Infarct area expansion III. Right Side: MTP-131 Protection Pathway (green arrow → repair response) 1. MTP-131 Targeting and Binding CL (top starting point) Elements: Green drug molecule icon (labeled “MTP-131”), pointing to mitochondrial CL via green arrow. Text Label: "Targeting and Binding CL, Stabilizing Mitochondrial Structure" Below in small text: Electrostatic interaction → Prevents CL oxidative degradation; Maintains inner membrane fluidity 2. Enhance Tafazzin Activity (middle link) Elements: Blue Tafazzin enzyme icon, upward green arrow ↑ (activity recovery); Bold conversion arrow from MLCL → CL (green). Text Label: "Enhance Tafazzin Activity, Restore CL Synthesis" Below in small text: MLCL deacylation-reacylation cycle ↑ → Mature CL production ↑ (MLCL/CL ratio ↓) 3. Inhibit ROS Generation (middle link) Elements: Red ROS symbol “⚡” covered by green “⊝” (indicating clearance). Text Label: "Inhibit ROS Generation, Block Oxidative Stress Cascade" Below in small text: Stabilize ETC → Electron leakage ↓; Directly clear free ROS 4. Final Effect (bottom endpoint) Elements: Normal mitochondria icon (orange, intact ridges); Green "Surviving Cardiac Myocyte" icon (complete cell outline); Bottom green "Heart Function Improvement" icon (upward arrow + LVEF%). Text Label: "Mitochondrial Function Recovery → Myocardial Protection" Below in small text: ① ATP production ↑; ② Apoptosis ↓; ③ Infarct area reduced by 54% (citing original data) IV. Bottom Summary Area (full-width banner) Background: Dark gray rectangle (semi-transparent) Text: White bold centered "VA-ECMO exacerbates myocardial injury through ‘oxidative stress → cardiolipin depletion → mitochondrial collapse’, while MTP-131 targets cardiolipin, rebuilding mitochondrial function, providing a new strategy for ‘drug-device combined therapy’." V. Visual Optimization Suggestions Color Specifications: Red (#E74C3C): Damage pathway text/arrows Green (#2ECC71): Protection pathway text/arrows Orange (#F39C12): Mitochondria/core elements Black (#333333): Icon outlines/small text descriptions Data Annotations: Highlight key conclusions with orange boxes around original data (e.g., “Infarct area reduced by 54%”, “MLCL/CL ratio ↓42%”). Icon Simplification: All biomolecule/cell icons should use a flat design style (avoid 3D complex effects), ensuring clarity. --ar 1:1 --v 7 --stylize 100

素材来源:Midjourney国内版官网
Copyright©2017 Midjourney9.com All Right
Reserved 版权所有:成都金翼云科技有限公司 蜀ICP备2023008999号