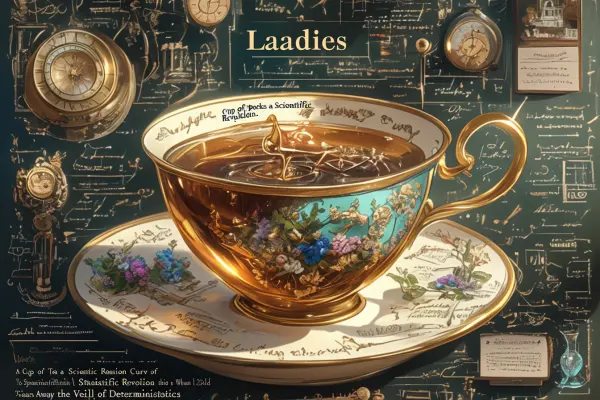
设计一个读书海报,书名是《女士品茶》,尺
提示词:Design a reading poster, the book title is "Ladies Tea," size 24 inches (60cm×40cm). The poster content requirements are as follows: 1. Core Visual Elements: The Integration of Tea and Data- Main Image: A classical English teacup as the main subject, with the tea represented by flowing "data symbols" (such as scatter plots, normal distribution curves, mathematical formulas) forming in the cup, the moment the tea splashes transforms into an abstract flow of numbers or code, suggesting "A Cup of Tea Sparks a Scientific Revolution."- Contrast Handling: Color Contrast The tea set uses retro warm tones (such as deep brown, gold), while the data symbols use cool tones (blue, silver-gray), creating a clash between tradition and technology. Material Contrast: The delicate porcelain texture of the teacup combines with the pixelated/vector lines of the data symbols, reflecting the intertwining of classical experimentation and modern statistics. 2. Background and Auxiliary Graphics: The Historical Context of Statistics Background Design: Utilizing the concept of a "timeline," integrating key figures from the history of statistics (such as Fisher, Gosset, Pearson) and classic experimental scenes (such as the Ladies Tea Experiment, t-test manuscripts) presented in light-colored lines or semi-transparent watermarks, enhancing the sense of historical weight. Auxiliary Graphics: Classic statistical models like "Experimental Design Quadrant Diagram" and "Regression Curve" surround the teacup, outlined with minimalist lines to avoid overwhelming the main focus. The bottom is decorated with tea stain-like scatter points, symbolizing the randomness of data distribution. 3. Title and Copy Design Main Title: "A Cup of Tea, a Scientific Revolution that Shakes the World" (Font Suggestion: Use serif font for the main title to reflect classical feel, sans-serif font for the subtitle to reinforce modernity) Subtitle: "When Statistics Tears Away the Veil of Determinism" (Citing descriptions of the 20th-century statistical revolution from the book, echoing the theme) Key Copy: Add a golden phrase from the book in the corner of the image: "Statistics is not mathematics, but a way to think about the world." 4. Creative Details and Metaphors Teacup Base: Designed in the shape of an hourglass, metaphorically representing the shift in statistical thinking from determinism to probability (echoing the webpage 3 title "Statistics is a Skyscraper Built on Sand"). Tea Leaf Shape: Floating tea leaves form statistical keywords like "P-value" and "Significance Test," hinting at the logic behind the data. Light and Shadow Effects: Hidden symbols of "causation and correlation" (such as arrows and wavy lines) within the shadow cast by the teacup, subtly referencing the book's emphasis on the misconception "correlation ≠ causation." Color Scheme and Typography Main Color Scheme: A gradient blend of deep blue (symbolizing scientific rationality) and tea brown (representing traditional experimentation), accented with gold (representing groundbreaking discoveries) and white (the purity of data). Typography Layout: Asymmetrical composition, focusing on the teacup and data flow on the left, leaving blank space on the right for the title and key copy, creating visual balance. Final Effect The poster uses the everyday scene of "a cup of tea" to visualize the abstract concepts of statistics, conveying the core ideas of the book through strong contrasting visual language—how statistics challenges determinism with randomness and reconstructs cognitive frameworks using data. The image combines the depth of historical narrative with the futuristic feel of scientific exploration, aligning with the book's positioning of "storytelling popular science." --ar 3:2 --stylize 841 --niji 6
素材来源:Midjourney国内版官网
Copyright©2017 Midjourney9.com All Right
Reserved 版权所有:成都金翼云科技有限公司 蜀ICP备2023008999号